Real Estate Data Pipeline, Part 2

In our last data adventure, the E and the T of our ETL process was accomplished by way of ingesting real estate data via web scraping with python; then, some transformations were done using Apache Spark to clean the data and format it as needed. Next, we're going to be loading it into AWS Redshift and doing some visualizations in Power BI.
Making a connection to AWS Redshift via Python can be a daunting task at first, but there are modules like AWS Data Wrangler (now known as AWS SDK for pandas) that can simplify the process somewhat. AWS SDK for Pandas, in their own words, is a "python initiative that extends the power of Pandas library to AWS connecting DataFrames and AWS data related services." And they boast "easy integration with Athena, Glue, Redshift, Timestream, OpenSearch, Neptune, QuickSight, Chime, CloudWatchLogs, DynamoDB, EMR, SecretManager, PostgreSQL, MySQL, SQLServer and S3 (Parquet, CSV, JSON and EXCEL)." But, this isn't an AWS Wrangler sales pitch, at this point I'm still exploring and checking out the available options.
For the sake of familiarity and time, I will spin up the RedShift instance directly through the AWS CLI, but know that this also can be automated. Automation is key, and a feature like this can really help in environments where RedShift is being used on a regular basis. That said, here are the environment variables set up so far for the connection to AWS:
# import environment variables
aws_table_name = os.environ.get("aws_table_name")
region = os.environ.get("region")
redshift_host = os.environ.get("redshift_host")
redshift_db = os.environ.get("redshift_database")
redshift_table = os.environ.get("redshift_table")
aws_user = os.environ.get("aws_user")
aws_pass = os.environ.get("aws_password")
iam_r = os.environ.get("iam_role")
port = os.environ.get("port")
As mentioned previously, environment variables help to keep sensitive data out of sight from malicious eyes. Once we have that in place, we can start building our connection string, which is formatted as such:
conn = connect(
host=redshift_host,
database=redshift_db,
user=aws_user,
password=aws_pass,
port=port
)
Once again, obviously the actual contents aren't hard-coded into the script, but you can get an idea of what the general structure looks like. One feature that's very useful in this case is that you can set things up such that Redshift can infer the schema from the dataframe:
schema = wr.catalog.table.infer_schema(pandas_df)
This can save a lot of time that would have otherwise been spent building your own schema file from the ground up. Granted, there may be use cases where that's still desirable, but it's good to know that the option exists. Now it's just a matter of creating a table in RedShift:
table = 'my_table'
schema = schema
columns_types = {
col: 'VARCHAR' for col in pandas_df.columns
}
wr.redshift.create_table(
df=pandas_df,
table=table,
schema=schema,
index=False,
dtype=columns_types,
con=conn
)
And then copying the data into our data warehouse:
table = 'my_table'
schema = schema
columns_types = {
col: 'VARCHAR' for col in pandas_df.columns
}
wr.redshift.create_table(
df=pandas_df,
table=table,
schema=schema,
index=False,
dtype=columns_types,
con=conn
)
Finally, we need a visual representation of our real estate data. I'm going to go with Microsoft's Power BI in this case, although in the future it might be cool to try out Tableau or Looker. Right away, we can choose from our available data sources:


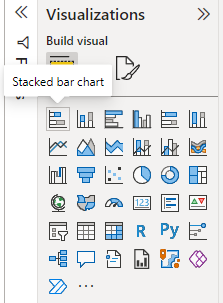
And display the results in a number of different visualizations. Of course, much more intriguing and complex displays can be made with Power BI but this provides a basic idea of what can be expected.
In sum, there were some interesting technologies that I got to learn. The data was ingested via python web scraping, cleaned with Spark, loaded into AWS RedShift and then displayed with Power BI.


Comments
Post a Comment